Interpret the Result
After the extraction has finished, the quality of the result can be found in four places:
- the graph,
- the final value of the objective,
- the parameter values and their precision, and
- the Chi Square test.
In the graph, the error bars of the data points come in different colors:
- Gray
- the default color when the data point does not fit the model.
- Green
- when the data point fits the model as specified by the fitting criterion.
Clicking the marker of a data point will show its coordinates and additionally its distance to the curve.
The Objective field at the bottom of the graphing pane displays the average distance of all valid data points.
The number of valid points is also displayed.
For the fitting criteria ModeSelection and Strict the objective value
will always be below one.
The values of the extracted parameters can end up outside their bounds. The bounds are only suggestions to allow ParX to optimally scale the parameters. A bounded solution would have no meaning in a modeling context. The optimizer will initially try to stay within the bounds, but if the optimum is to be found outside them, so be it. This is especially true for parameters that have little or no effect on the model curves in the region of interest where the data is located. These parameters should be marked as fixed.
At the bottom of the graphing pane, the number of independent parameters is displayed.
If this number is lower than the number of free (not fixed) parameters, some parameters
are closely interrelated.
To find out which parameters are involved, take a look at the parameter precision.
During the optimization, one of the redundant parameters will have been frozen,
which is indicated by a precision value of infinity (∞).
Set this parameter to fixed and give it a convenient limiting value (like 0) and redo the extraction.
The precision of the extracted parameters is displayed after their respective names in the model pane. The returned values are derived from a sensitivity analysis. The sensitivity of the final objective value to variations in the parameter values is determined. So a small value of the objective and/or a large sensitivity will result in high precision for that parameter, or a narrow interval.
The parameter precision values are a measure of consistency, not of accuracy.
Depending on the nature of the remaining errors, i.e., distances,
in the data points, different interpretations are possible.
The default interpretation can be set in the Settings Window.
When the remaining errors are systematic in nature, caused by the limitations of the model,
the best choice is consistency.
This is a measure of the sensitivity of the final value of the objective to variations in the parameter values.
The general rule is that a large objective value and low sensitivity will result in low precision (high value).
When the errors are stochastic (random), the other options can be appropriate. These specify a probability interval, i.e., the interval where the “true” value of the parameter is located with the specified level of probability.
The probabilistic precision estimates depend on a detailed statistical modeling of the errors to be reliable. The same holds for the result of the Chi Square (𝛘²) test. A result close to zero usually means that the model is a bad fit to the data and the remaining errors are systematic in nature. Or, the data errors were underestimated. A result too close to one is also suspect. This usually means that the data errors were overestimated. Aim for a value between 0.1 and 0.8 for the test to have any significance.
The ChiSquare fitting criterion uses a value of 0.5.
Data Outliers
When the model and the measurement data do not agree, both can be at fault. The designation “outlier” puts the blame on the data. Outliers can have good precision (repeatability), as indicated by their error bars, but are spoiled by environmental conditions. Therefore, they add no information about the model and its parameters. They also have no relation to each other. This makes it possible to isolate and eliminate them, as shown in this example:
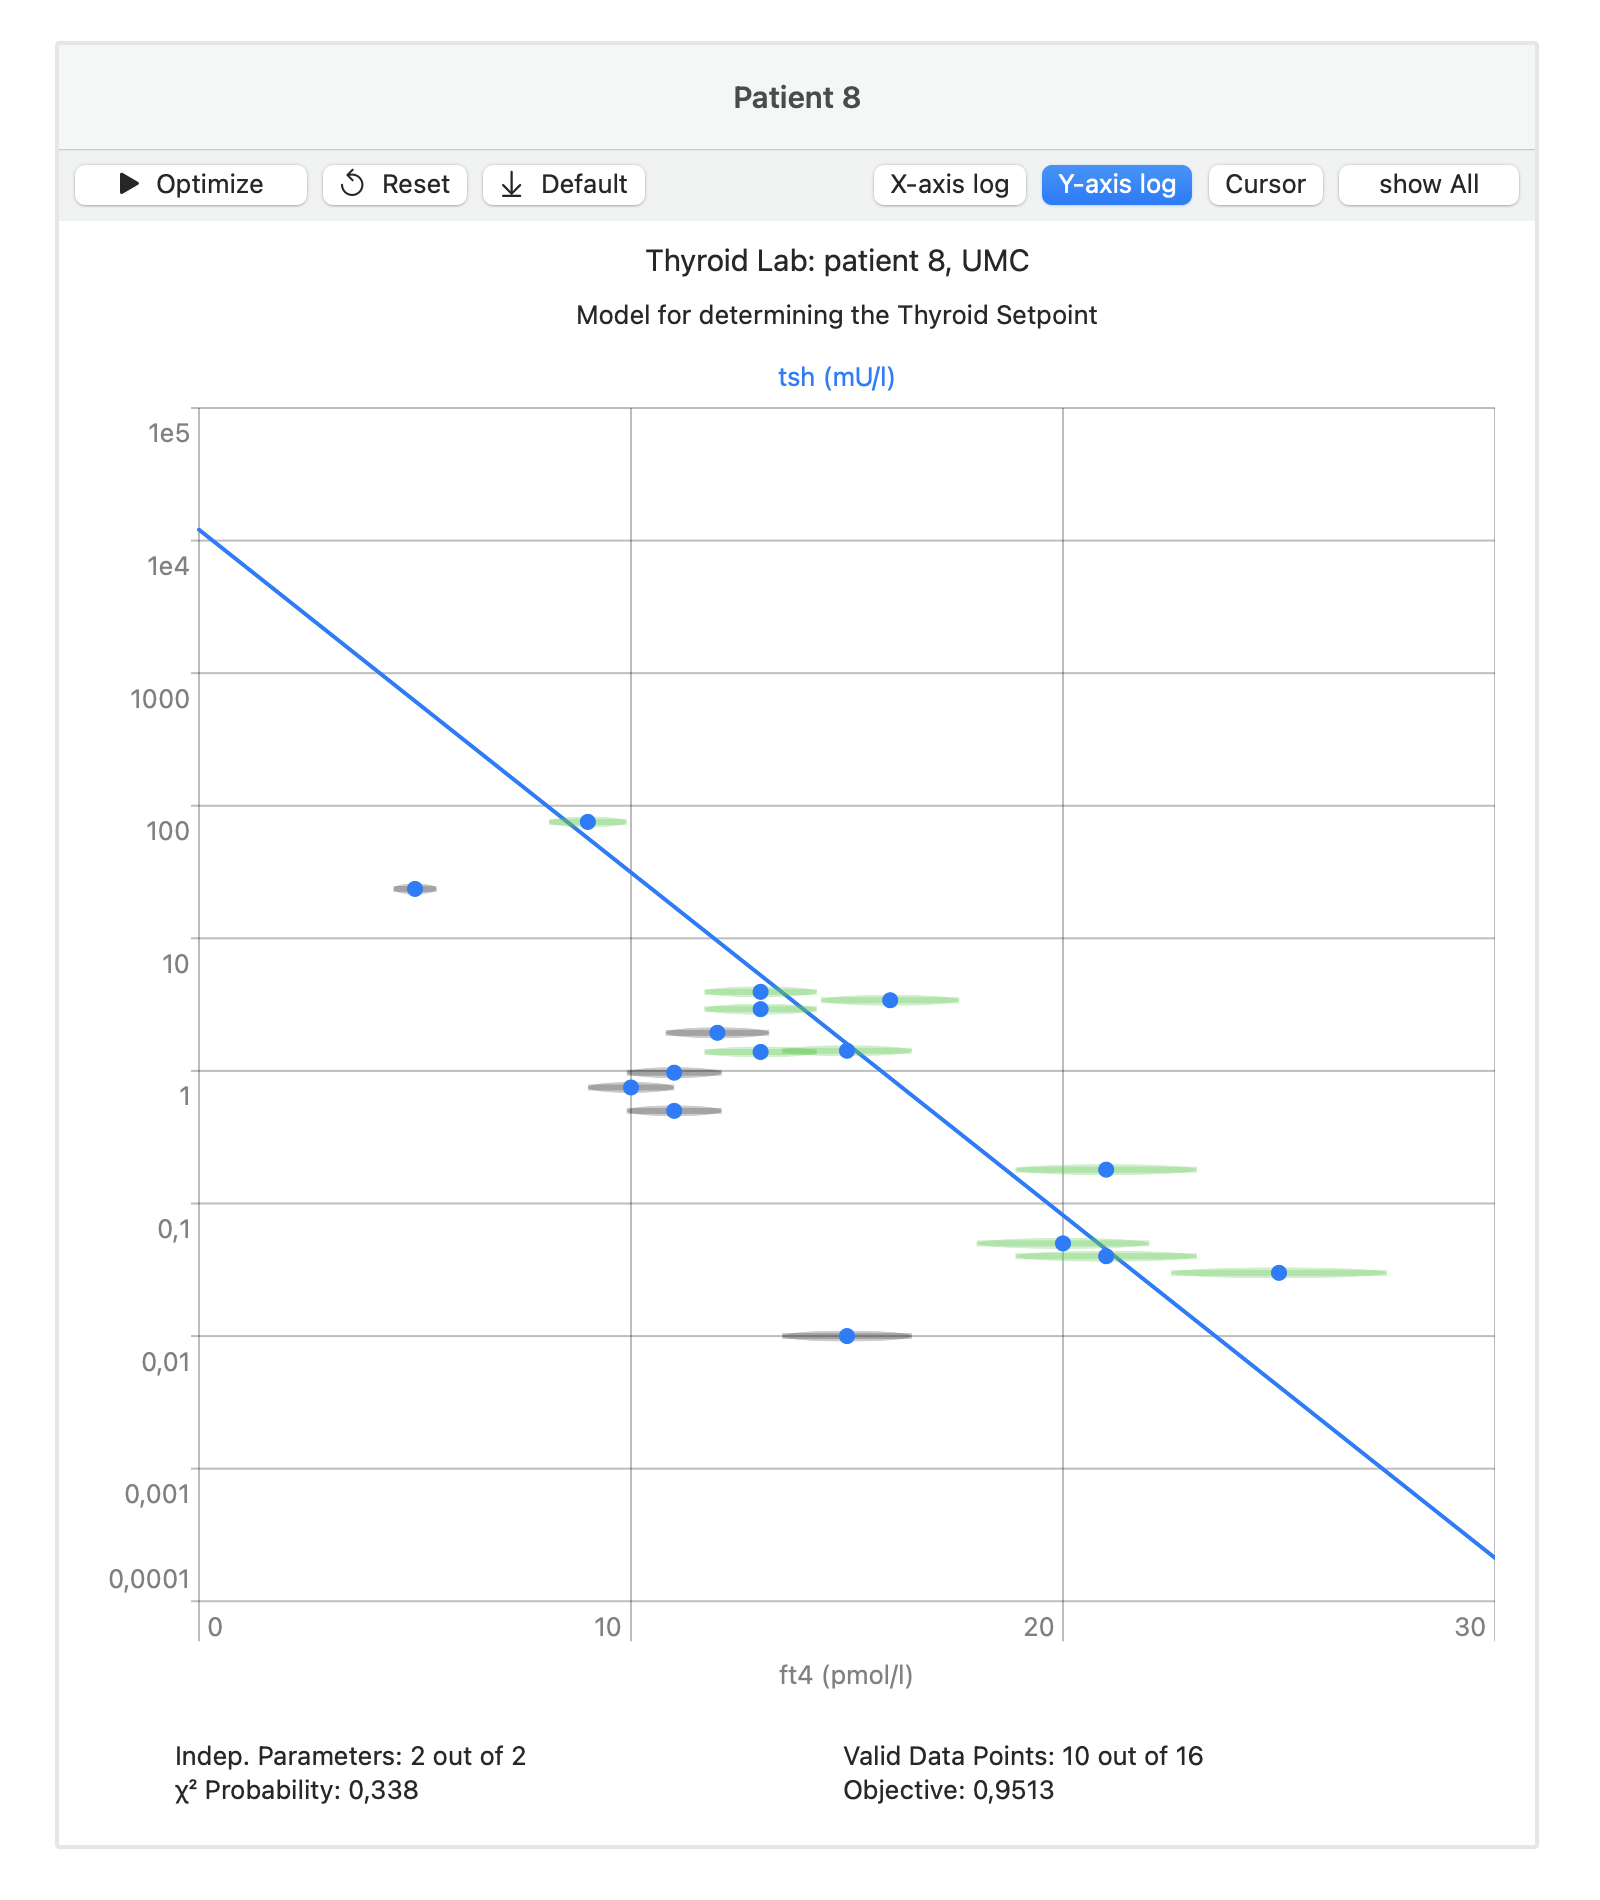
The remaining data points are marked with the green error intervals. The invalidated data points are marked in gray.
Model Validity Domain
When the errors are systematic in nature, for example, when the model does not encompass the full behavior of the measured subject, the data will only fit the model within its validity range:
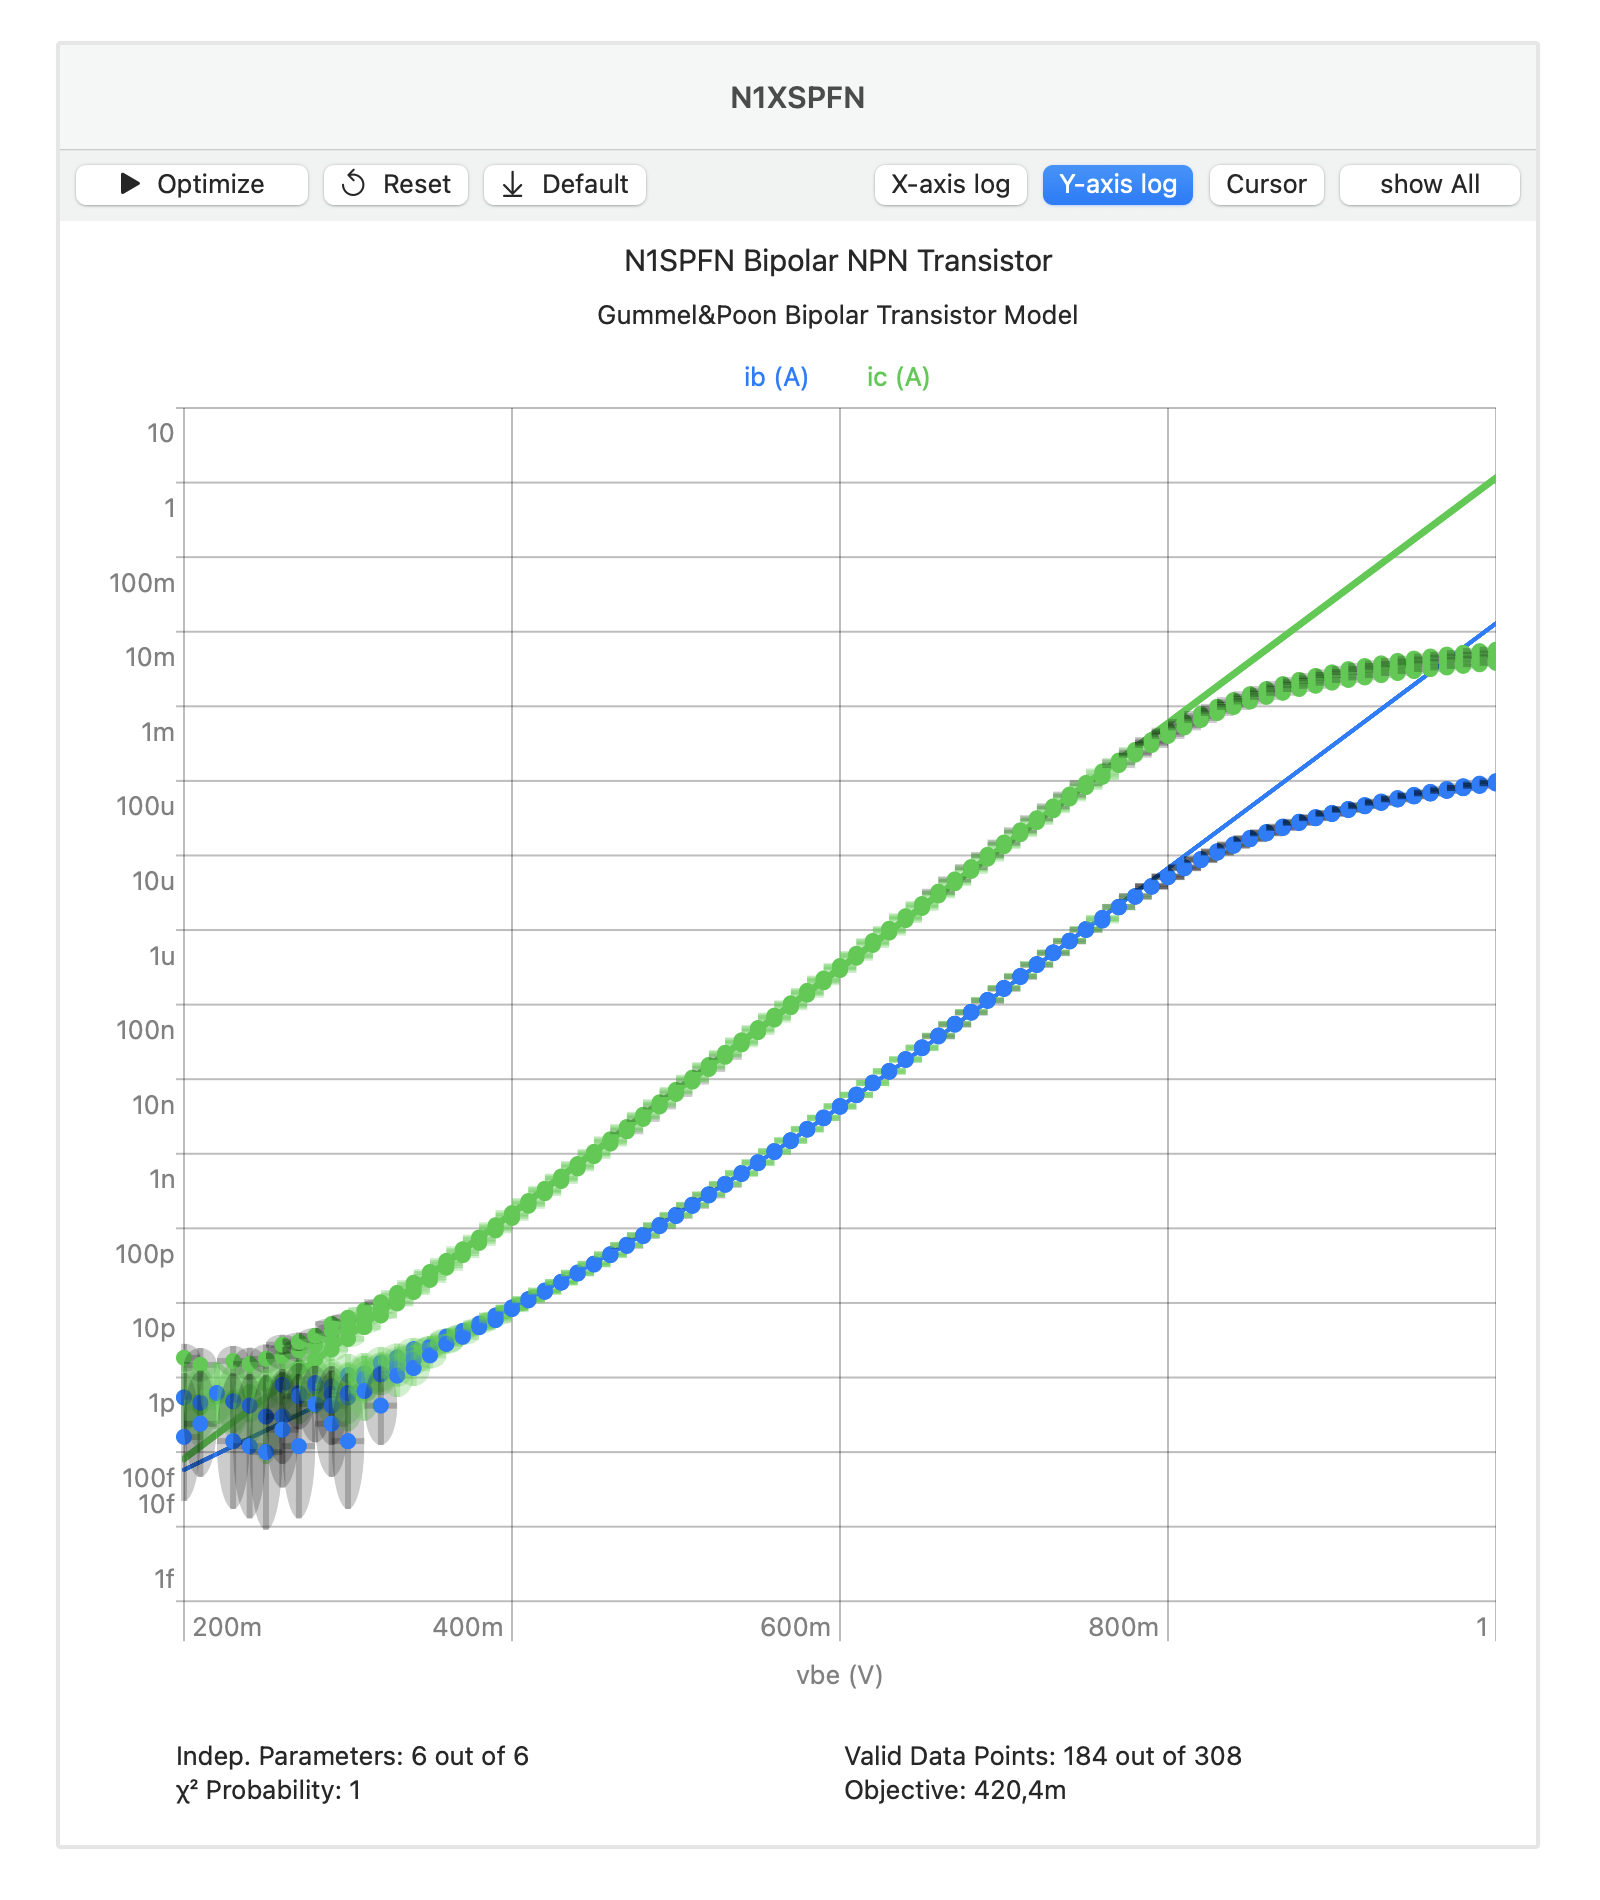
The validity range of the model is limited to the low and middle portion of the data (green error intervals). We still get the correct parameters for the simplified model, because only those data points are used in their calculation that can be accurately described by it.