Getting Started
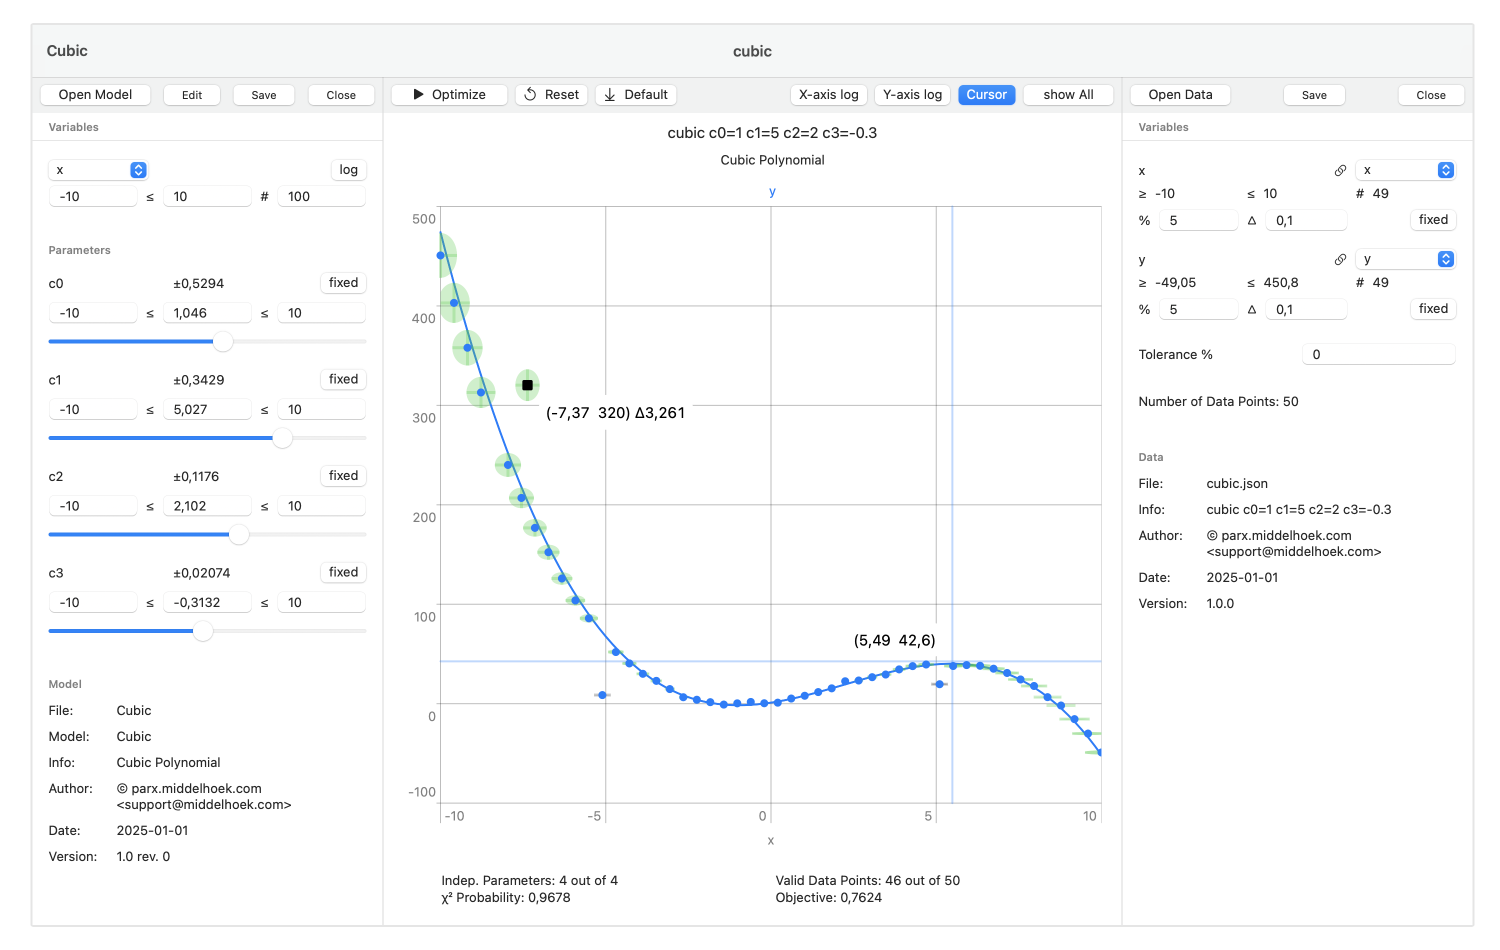
The single application window is split in three panes: the model pane, the graphing pane, and the data pane.
The model pane represents the model with its interface variables and parameters. The model definition file can be opened either through the file menu, the toolbar, or by dragging and dropping a model file on the model pane.
After selecting and specifying the axis variables and their ranges in the model pane, the model behavior is plotted in the graphing pane. Any changes in the variable ranges and/or parameter values animate the graph. This is the perfect way to explore the model’s behavior and its limits.
The data pane represents the measured data. The data file can be opened through the file menu, the toolbar, or by dragging and dropping a data file on the data pane. The measured data, the data points and their error intervals, are plotted in the graphing pane on the axes specified in the model pane. Because the interface variables and the drawing axes are defined by the model, a data file can only be opened after the model is opened first, and plotted only after the model is plotted.